

This Content Is Only For Subscribers
Please subscribe to unlock this content. Enter your email to get access.
在專案開發階段和模擬測試時application的效能如何常常被忽略掉,在開發或是測試環境上要是能看到目前運作的狀況、執行的效率與執行時間多長,是非常重要的,如果你的目標是要做好一個穩定的系統,絕對不能忽略效能這件事。
這邊就要在.Net core 的Project 使用MiniProfiler這個套件來做application的效能監控。
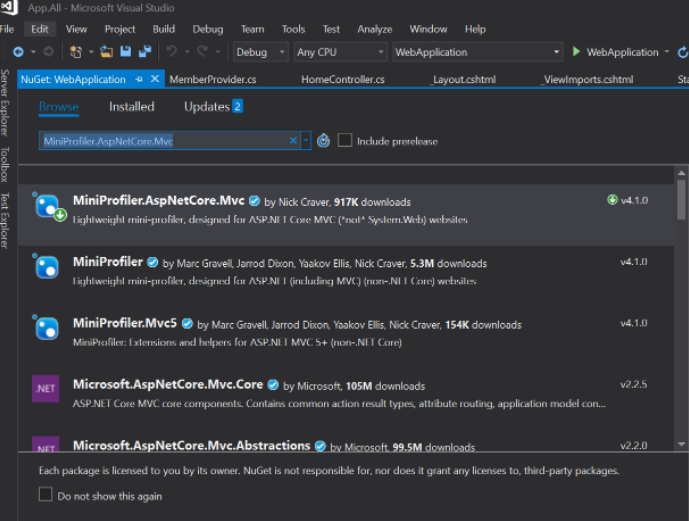
Step1:首先請使用NuGet 再來查詢:MiniProfiler.AspNetCore.Mvc 接著將它安裝
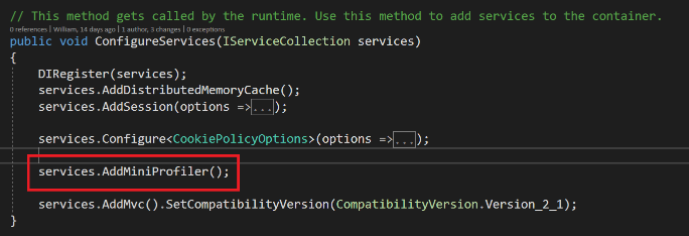
Step2: 在Startup.cs的ConfigureServices方法中,註冊MiniProfiler
services.AddMiniProfiler();
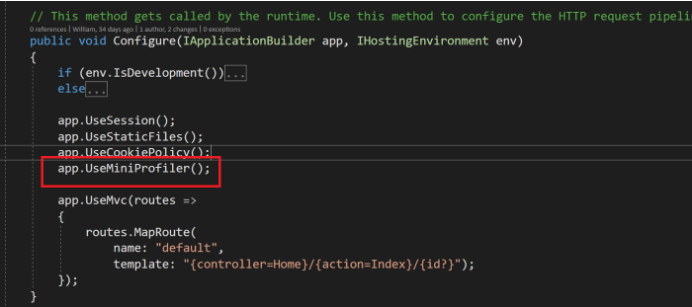
Step3:在Startup.cs的Configure方法中,加入 MiniProfiler的middleware function;這個middleware會錄製Http的請求執行的情況。
app.UseMiniProfiler();
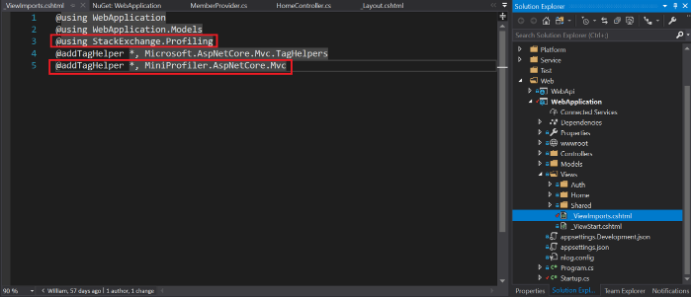
Step4:在_ViewImports.cshtml 加入 Tag Helpers
@using StackExchange.Profiling
@addTagHelper *, MiniProfiler.AspNetCore.Mvc
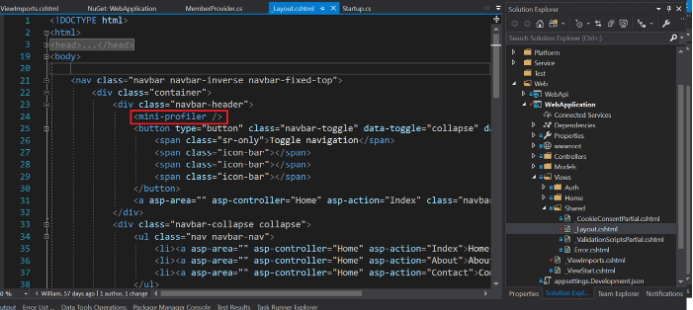
Last Step:在_Layout.cshtml 加入MiniProfiler 的 Html Tag
<mini-profiler />
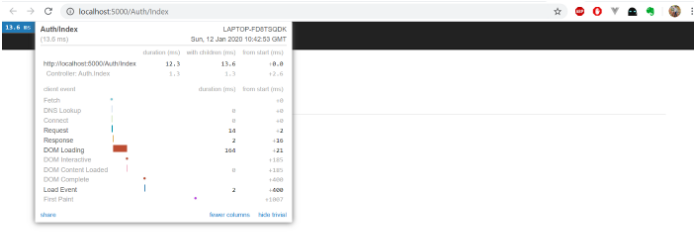
run application
會在左上角看到一個Miniprofiler的小視窗,可以點進去會跳出更詳細的資訊,圖下會有像是在進入 Auth/Index 時的Request duration time、Response duration time and DOM Loading time …..
MiniProfiler其實也可以對於背後執行的sql statement 進行錄製並且顯示在詳細內容裡之後會再分享出來,這次先以初階篇為主,如何套用這個套件。
進階篇傳送門:
下一篇 : .Net Core Project 從零開始 — Miniprofiler record Dapper SQL Statement
.Net Core Project GitHub:Link
參考文章

")